Google has a tool integrated with in gmail. The document function goes beyond the typical word processing and allows the user to create and send out surveys. Google then gathers the information and will even turn the numbers into pie charts and graphs!
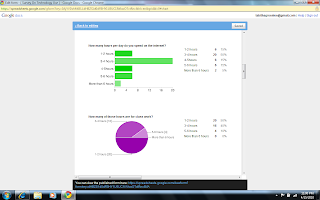
I created a survey on technology use, here are some of the results.
(Thank You to the 41 people who responded!)
~ 50% use a computer for 3-4 hours a day
~50% say 1-2 of these hours are for school work
~ 93% are a member of a social networking site
~ all who responded were members of Facebook
~ 53% say they Facebook during class time
~ everyone who responded sends/receives text messages
~ 73% text during class
Want to see the results for yourself? This is a great tool, fun and easy to use!
Excellent! And I will use the last column of data in my post I am working on.
ReplyDelete